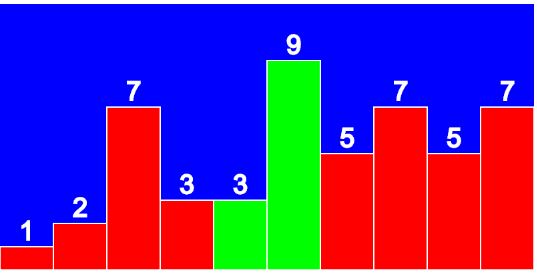
Click on the canvas to refresh the animation
I wanted to make a visualization for an algorithmic problem involving backtracking when I noticed the solution was remarkably similar to Bubble Sort. As it is often very helpful to work on a simpler, related problem than tackling a complex problem straight away, I decided to make a Bubble Sort Visualizer as a step on the way to solving the original problem (which was to find the minimum value that can be formed by swapping k digits in a positive integer). You can read more about Bubble Sort here.
I did a bit of digging around to find if there were any tools which could help with this project, and I stumbled upon p5.js, which a fantastic tool based on JaveScript.
p5.js is a JavaScript library for creative coding, with a focus on making coding accessible and inclusive for artists, designers, educators, beginners, and anyone else! p5.js is free and open-source because we believe software, and the tools to learn it, should be accessible to everyone.
With a little bit of work I was able to come up with the visualization above for Bubble Sort using remarkably few lines of code.
Code Listing for Bubble Sort Visualization with p5.js
The code listing for this visualization is below, with comments to help you understand how it works.
One thing that caught me out getting this to work was variable scope. There were a few places where I initially used the JS let keyword when I wanted to access a global variable (p5.js appears to make a lot of use of these…). Using let meant new local versions of variables were created which did not contain the values I expected. Just a heads up, that is something to look out for when working with p5.js.
const numBars = 10;
const fps = 1;  // Frame rate
let bars = [];
let barWidth;
let currentBar;
let i;
let j;

// The statements in the setup() function
// execute once when the program begins
function setup() {
    frameRate( fps );
    myCanvas = createCanvas( 800, 400 );
    myCanvas.parent("bubbleSort");
    barWidth = width / numBars;
    stroke( 255 );
    strokeWeight( 2 );
    myReset();
}

// The statements in the draw() function are executed until the
// program is stopped.
function draw() {
    background( 0, 0, 255 );
    bubbleSort();
    drawBars();
}

// The Bubble Sort Algorithm
function bubbleSort() {
    currentBar = j;
    if ( i < bars.length ) {
    let temp = bars[j];
    if ( bars[j] > bars[j + 1] ) {
        bars[j] = bars[j + 1];
        bars[j + 1] = temp;
    }
    j++;

    if ( j >= bars.length - i - 1 ) {
        j = 0;
        i++;
    }
    } else {
    noLoop(); // Stop calling draw() once we are done.
    }
}

// Prepare the bars for drawing by draw()
function drawBars() {
    window.console.log(bars);
    for ( const [idx, val] of bars.entries() ) {
    barHeight = ( height - 50 ) / 10 * val;
    topLeftX = idx * ( barWidth );
    topLeftY = height - barHeight
    // rect uses topLeftX, topLeftY, width, height
    if ( idx == currentBar || idx == currentBar + 1 ) {
        fill( 0, 255, 0 ); // green
    } else {
        fill( 255, 0, 0 ); // red
    }
    rect( topLeftX, topLeftY, barWidth, barHeight );
    textSize( 40 );
    textAlign( CENTER );
    fill( 255 )
    text( val, topLeftX + barWidth / 2, topLeftY - 10 );
    fill( 255, 0, 0 );
    }
}

function myReset() {
    bars = [];
    i = 0;
    j = 0;
    bars[0] = Math.floor( ( Math.random() * 9 ) + 1 );  // between 1 and 9 inc.
    for ( let i = 1; i < numBars; i++ ) {
    bars[i] = Math.floor( Math.random() * 10 ); // between 0 and 9 inc.
    }
    loop();
}

function mousePressed(){
    myReset();
}
The HTML you will need is:
<div id="bubbleSort"></div>
Along with the p5.js source from a CDN. E.g.
<script src="https://cdnjs.cloudflare.com/ajax/libs/p5.js/1.1.9/p5.min.js" integrity="sha512-WIklPM6qPCIp6d3fSSr90j+1unQHUOoWDS4sdTiR8gxUTnyZ8S2Mr8e10sKKJ/bhJgpAa/qG068RDkg6fIlNFA==" crossorigin="anonymous"></script>
If you want to get p5.js you can download it or get a link to the CDN version here.
I hope you find something of value in this article, whether it’s the Bubble Sort visualization itself or maybe some inspiration to check out p5.js for yourself.
Happy Computiung.
