The problem – Seaborn distplot is deprecated
Staring with version 0.11.0 of the Python Seaborn data visualization library, distplot is a deprecated function, and will be removed in a future version.
You can see the warning if you run the code below.
import seaborn as sns
import matplotlib.pyplot as plt

sns.set_style("darkgrid")

# Load the default dataset that comes with Seaborn
tips_data = sns.load_dataset("tips")
# Inspect the first 5 rows of the data
tips_data.head()
| total_bill | tip | sex | smoker | day | time | size | |
|---|---|---|---|---|---|---|---|
| 0 | 16.99 | 1.01 | Female | No | Sun | Dinner | 2 |
| 1 | 10.34 | 1.66 | Male | No | Sun | Dinner | 3 |
| 2 | 21.01 | 3.50 | Male | No | Sun | Dinner | 3 |
| 3 | 23.68 | 3.31 | Male | No | Sun | Dinner | 2 |
| 4 | 24.59 | 3.61 | Female | No | Sun | Dinner | 4 |
Create a Histogram Using Seaborn
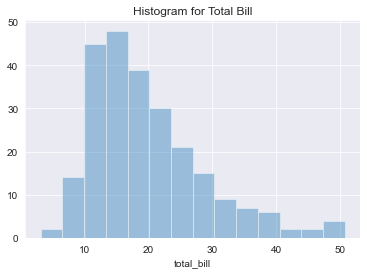
# Plot a histogram for the total bill
sns.distplot(tips_data["total_bill"], kde = False).set_title("Histogram for Total Bill")
plt.show()
You can see the warning below:
c:\program files\python39\lib\site-packages\seaborn\distributions.py:2557: FutureWarning: `distplot` is a deprecated function and will be removed in a future version. Please adapt your code to use either `displot` (a figure-level function with similar flexibility) or `histplot` (an axes-level function for histograms).
  warnings.warn(msg, FutureWarning)
The Solution – Use Seaborn displot
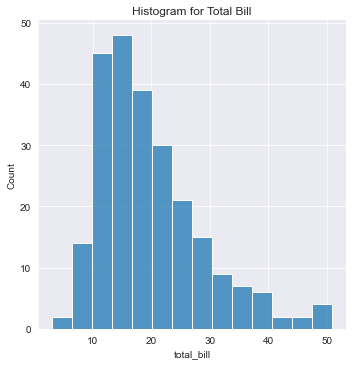
Use sns.displot() instead. Notice that the set_title() method doesn’t exist so we use plt.title() instead.
# Plot a histogram for the total bill
sns.displot(tips_data["total_bill"], kde = False)
plt.title("Histogram for Total Bill")
plt.show()
Now your basic Python Seaborn histograms are future-ready. You may also want to use sns.histplot(), an axes-level function for plotting histograms (sns.displot() is figure-level). Checkout what’s new in the latest version of Seaborn here.

thank you.