Random Graphs in Python for A Level Computer Science and Beyond
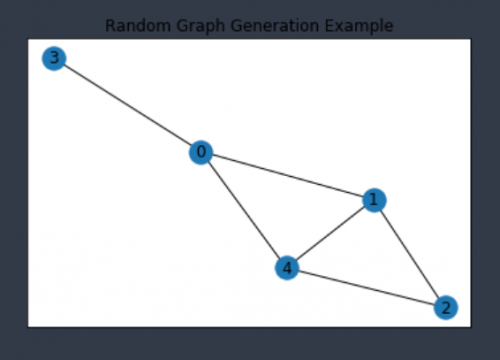
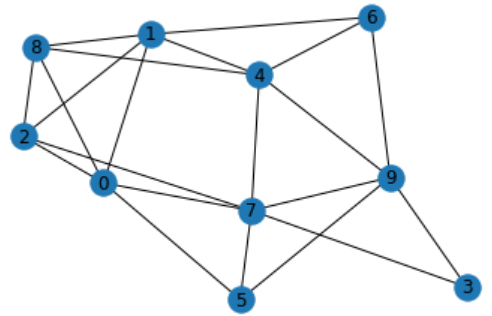
The jupyter notebook below shows an implementation of an algorithm for generating a random undirected, unweighted graph. The algorithm uses the Erdős–Rényi model, but you don’t need to know about that to understand how it works – the pseudo code makes is quite clear, although you may need to spend a little time understanding exactly what it conveys. It may be that looking at the Python code first will give you more insight due to the wonderful clarity of Python syntax.
If you don’t use jupyter notebooks, don’t worry, the code will work just fine from your usual IDE, as long as you install the networkx package and remove the % commands (e.g %matplotlib inline) For info on installing Python packages see here.
The main purpose of this article is to get you up and running creating random graphs to help you with studying or teaching algorithms for A Level Computer Science and beyond. You can use the code to generate sample graphs to deepen your understanding of graph algorithms such as Dijkstra’s algorithm and the A Star Algorithm, or to generate questions for your students.
In terms of A Level Computer Science this will be more relevant to those studying for or teaching the OCR or AQA syllabus than the Cambridge one.
Please note, in the code, n is the required number of nodes and p is the probability that an edge exists between a given pair of nodes.
There are more articles/videos on working with graphs and/or jupyter notebooks in Python here on the Compucademy blog. For example
- Graphs in Python for A Level Computer Science
- http://compucademy.net/python-for-gcse-science-and-maths/

