A sphere is a fundamental geometric shape that often finds applications in mathematics, physics, computer graphics, and engineering. It’s defined as the set of all points in three-dimensional space equidistant from a common centre point. In this article, we’ll explore how to draw a sphere in Python, calculate its volume and surface area using appropriate formulas.
Drawing a Sphere in Python
To visualize a sphere in Python, we can utilize the popular graphics library, Matplotlib. Before we proceed, ensure that you have Matplotlib installed. You can install it using pip:
pip install matplotlib
Now, let’s create a Python script to draw a sphere:
import matplotlib.pyplot as plt
from mpl_toolkits.mplot3d import Axes3D
import numpy as np
# Create a dark-themed figure
fig = plt.figure()
fig.patch.set_facecolor('#222222') # Set background color to dark gray
ax = fig.add_subplot(111, projection='3d')
ax.set_facecolor('#222222') # Set plot background color to dark gray
# Sphere parameters
center = (0, 0, 0)
radius = 1
phi = np.linspace(0, np.pi, 100)
theta = np.linspace(0, 2 * np.pi, 100)
# Create a mesh grid for the sphere
phi, theta = np.meshgrid(phi, theta)
x = center[0] + radius * np.sin(phi) * np.cos(theta)
y = center[1] + radius * np.sin(phi) * np.sin(theta)
z = center[2] + radius * np.cos(phi)
# Plot the sphere with interesting colour
ax.plot_surface(x, y, z, color='#FF5733', alpha=0.8) # Orange color
# Set axis labels and text color
ax.set_xlabel('X-axis', color='white')
ax.set_ylabel('Y-axis', color='white')
ax.set_zlabel('Z-axis', color='white')
ax.tick_params(axis='x', colors='white')
ax.tick_params(axis='y', colors='white')
ax.tick_params(axis='z', colors='white')
# Set title and title color
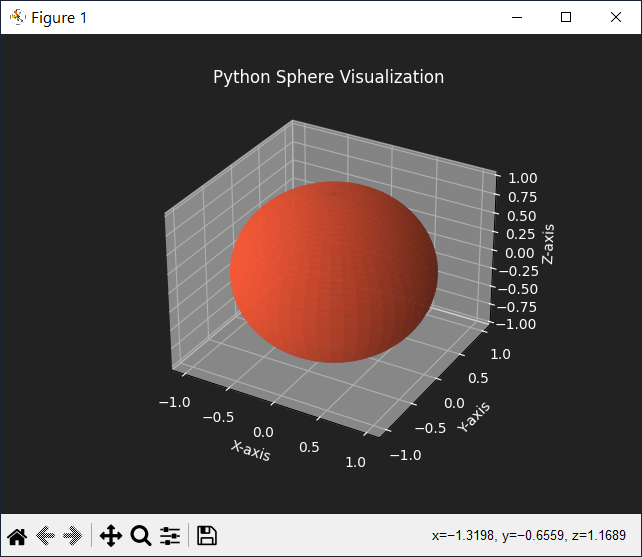
ax.set_title('Python Sphere Visualization', color='white')
# Show the plot
plt.show()
This code uses Matplotlib to create a 3D plot of a sphere. It defines the sphere’s parameters, such as its centre, radius, and the angles phi and theta. The mesh grid is used to calculate the points on the sphere’s surface, and then it is plotted.
Calculating Sphere Volume and Surface Area
Now, let’s calculate the volume and surface area of the sphere using the appropriate formulas.
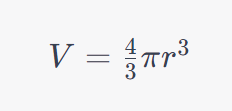
The formula for the volume of a sphere is:
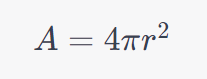
The formula for the surface area of a sphere is:
We can calculate these values in Python:
import math

# Radius of the sphere
radius = 1

# Calculate the volume
volume = (4/3) * math.pi * radius**3

# Calculate the surface area
surface_area = 4 * math.pi * radius**2

# Print the results
print(f"Sphere Volume: {volume:.2f}")
print(f"Sphere Surface Area: {surface_area:.2f}")
By plugging in the radius of the sphere into these formulas, we can calculate its volume and surface area.
Conclusion
In this article, we explored how to draw a sphere in Python using Matplotlib and calculate its volume and surface area. Spheres are not only important in geometry but also have practical applications in various fields, from physics to computer graphics. By understanding how to work with spheres in Python, you can apply these concepts to solve more complex problems in your chosen domain.