In this article we are going to explore how to use Python to solve quadratic equations and display the graphs of quadratic functions.
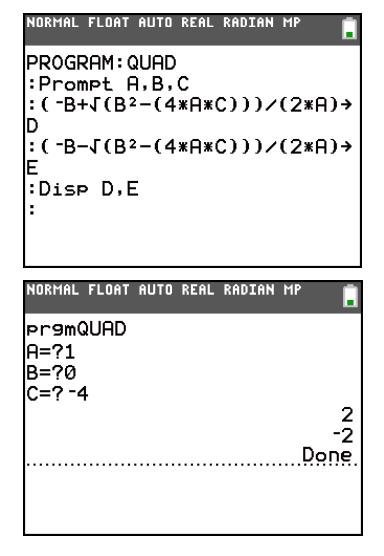
Many years ago I used to use TI-84 graphing calculators to teach Maths. One great feature of these calculators is that you can actually write programs on them, using a language called TI-BASIC. Some of you who are familiar with pseudocode from the various Computer Science exam syllabuses in the UK may notice a similarity between pseudocode and TI-BASIC (and other forms of BASIC – one of the most widely used languages when home computers first became “a thing”). That is a story for another time though.
Using TI-BASIC to solve quadratic equations looked something like this:
Things have come a long way since the days of BASIC, although messing around with it certainly can be educational. When it comes to using programming to enhance Maths learning though, Python is much more powerful and accessible.
Python Program for Solving Quadratic equations
The program below is based on the famous quadratic equation formula. Input your values for a, b, and c from the equation in form ax² + bx + c = 0, and the (real) solutions will be displayed if there are any.
"""
A Python program to solve quadratic equations in the form
ax^2 + bx + c = 0
"""
import math

a = int(input("Enter the coefficient a: "))
b = int(input("Enter the coefficient b: "))
c = int(input("Enter the coefficient c: "))

d = b ** 2 - 4 * a * c  # this part is called the discriminant

if d < 0:
    print("The equation has no real solutions")
elif d == 0:
    x = (-b + math.sqrt(b ** 2 - 4 * a * c)) / (2 * a)
    print(f"The equation has one solution: {x} ")
else:
    x1 = (-b + math.sqrt(b ** 2 - 4 * a * c)) / (2 * a)
    x2 = (-b - math.sqrt(b ** 2 - 4 * a * c)) / (2 * a)
    print(f"The equation has two solutions: {x1} or {x2}")
Sample output:
Enter the coefficient a: 1
Enter the coefficient b: -5
Enter the coefficient c: 6
The equation has two solutions: 3.0 or 2.0
Plotting a Quadratic Function with Python
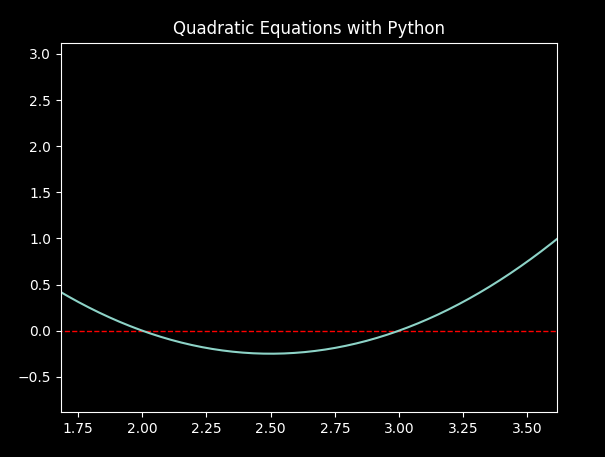
There are some awesome open-source tools available for working with mathematics in Python. For example we can use the matplotlib package (installation may be needed) to visualize a quadratic function and see where it intersects the x-axis (its real solutions). The code below gives a way to do this. Once your graph is produced, you can zoom in to see the solutions if needed.
import matplotlib.pyplot as plt
import numpy as np
plt.style.use("dark_background")

# Create 1000 equally spaced points between -10 and 10
x = np.linspace(-10, 10, 1000)

# Calculate the y value for each x value
y = a * x ** 2 + b * x + c

# Plot the x, y pairs
fig, ax = plt.subplots()
ax.set_title("Quadratic Equations with Python")
ax.plot(x, y)

# Plot a zero line
ax.hlines(y=0, xmin=min(x), xmax=max(x), colors='r', linestyles='--', lw=1)

# Show the plot
plt.show()
The code uses np.linspace() (from the numpy library) to create an array of values the x part of the coordinates to be plotted. We then create a corresponding array of y-values with y = a * x ** 2 + b * x + c. There are other ways to achieve this without numpy, but this approach is so simple that it is worth importing (and installing) numpy for.
This article has shown you how to use Python to find the solutions to quadratic equations and plot quadratic functions. I hope you found it interesting and helpful. Happy computing!

