It often surprises me how little integration there seems to be between Computer Science and other STEM subjects.
Just think of the possibilities!
Python is the language of choice for working with data in a vast range of professional fields. Astronomy? Of course. Marine Biology? You bet. Financial Analyst? Yep! Wouldn’t it be good to give students a head start with careers by teaching them how to leverage the power of computer programming in their chosen field? Python can (and should, IMO) be a go-to tool for work involving heavy calculation or analysis of data.
If you choose to look into this idea, you will very likely come across Jupyter Notebooks. These offer a great way to work with Python easily and interactively, with output and documentation all in one place. In many professional and academic fields, these notebooks have become the de facto standard for sharing research.
There is a bit of a learning curve to get comfortable with using Jupyter Notebooks, but it is well worth the effort and before long they could easily replace your current favourite environment.
Assuming you have an up-to-date version of Python (3.4 or above), then the easiest way to install Jupyter is via pip. If you don’t know how to do this, we have an article here which explains how.
Open a terminal and type
pip install jupyter notebook
Press enter and wait for the package to install. Then type
jupyter notebook
and press enter. After a short while, if all has gone well, Jupyter Notebook will open in your browser.
There are several standard libraries used for working with data in Python. One is pandas which provides all sorts of tools for analyzing and manipulating datasets, and another important one is matplotlib which allows you to to create many different types of data plot with relative ease.
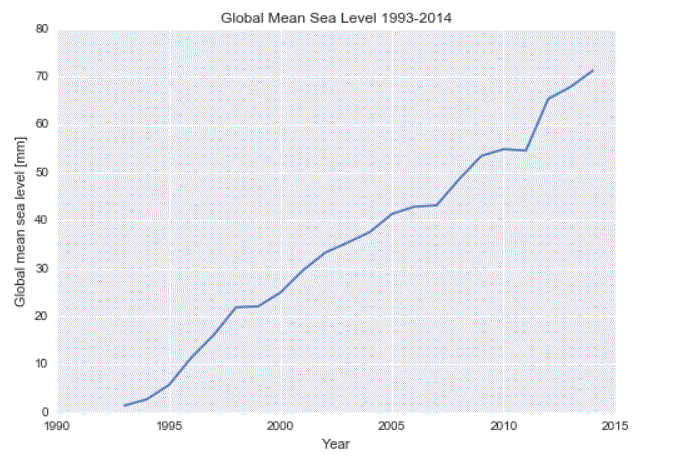
To give you an idea of what’s possible with just a bit of initial set-up and learning, take a look at the notebook below. Remember though that the real power of Jupyter Notebooks is that you can actually run and edit the code in real time when you have the software installed.
Jupyter Notebook Example – Global Mean Sea Level
With just a few lines of code we have plotted data for the Global Mean Sea Level from US Environmental Protection Agency. Climate change anyone? The more discerning among you may ask exactly what is being represented by the graphs and it data. For example, what is the baseline from which the measurements are taken?
If Python can help to create more statistically aware, discerning and misinformation-resilient citizens, then it will have served us well.
