
In this lesson, we are going to learn how to retrieve and display stock data using the YFinance library, which makes use of Pandas, the famous and powerful Python data processing library.
Python Code Listing to Get Latest Stock Price by Ticker
Check out the code below for how to fetch the latest closing stock price by ticker using YFinance. It uses the Ticker module, which allows you to access ticker data with ease.
import matplotlib.pyplot as plt
import seaborn as sns
import yfinance as yf


def get_latest_closing_price(symbol):
    try:
        ticker = yf.Ticker(symbol)
        data = ticker.history(period="1d")
        return data["Close"][0]
    except Exception as e:
        print("Failed to get required data.", e)


ticker = "FB"  # Facebook
print(f"Latest closing price for {ticker} is: ${get_latest_closing_price(ticker):.2f}")
Sample output:
Latest closing price for FB is: $280.79
Notice that we used todays_data = ticker.history(period="1d") to fetch data for the last day only. Other possible values for the period argument are:
1d5d– by number of days1mo,3mo,6mo– by number of months1y,2y,5y,10y,ytd– by number of years (ytd is “year to date”)max– the maximum period available
We can amend the Python code above to take an argument for the period we are interested in, to make it more flexible. Also, although we won’t be using it here, note that more information than just the closing price for a stock is available from the Ticker. For example:
- Open
- High
- Low
- Close
- Volume
Python code Listing to Get Stock Price by Ticker and Period
import matplotlib.pyplot as plt
import seaborn as sns
import yfinance as yf


def get_closing_prices(symbol, period="1mo"):  # default value of 1 day.
    try:
        ticker = yf.Ticker(symbol)
        data = ticker.history(period)
        return data["Close"]
    except Exception as e:
        print("Failed to get required data.", e)


ticker = "FB"
period = "1mo"
prices_data = get_closing_prices(ticker, period)
prices_list = [round(val, 2) for val in prices_data.tolist()]  # Round the values
print(f"Latest month closing prices for {ticker} are: {prices_list}")
Sample output:
Latest month closing prices for FB are: [257.62, 264.91, 259.0, 255.41, 257.64, 264.28, 255.31, 265.74, 264.9, 273.88, 268.4, 273.75, 279.28, 284.01, 278.62, 290.11, 293.54, 290.63, 282.14, 278.74, 280.42]
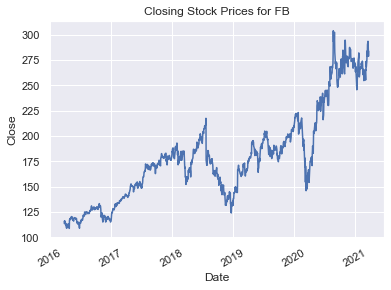
Plotting Stock Data with Seaborn
We are going to use Seaborn to plot the stock prices against time. You will need to install this module using pip if you haven’t already. Seaborn provides an API on top of Matplotlib that has great default choices for plot style and colours.
The data type of the prices_data variable we created above from the return value of get_closing_prices() is pandas.core.series.Series. The indices for the values in this series are Pandas timestamps. To plot this data using Seaborn we can use the code below.
ticker = "FB"  # Facebook
period = "5y"
prices_data = get_closing_prices(ticker, period)

sns.lineplot(data=prices_data)
sns.set_theme()  # Default seaborn style
plt.xticks(rotation=30)
plt.title(f"Closing Stock Prices for {ticker}")
plt.show()
And there you have it. With the awesome power of Python at your disposal, along with some equally awesome open-source libraries, some pretty impressive feats can be achieved with just a few lines of code.
This article has shown you how to retrieve stock data using Python and the YFinance library. I hope you found it interesting and helpful.
Happy computing!